New page speed chart
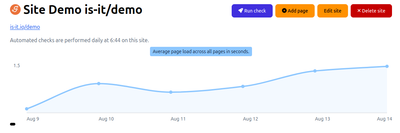
The site view got a new page speed chart which shows the cumulated page speed of all pages from the loaded checks. This allows you to see how your site performs over time and helps you identify trends or issues that may arise.
The chart is designed to be intuitive and easy to read, providing a clear visual representation of your site's performance metrics. You can hover over data points, to get the real value at that date.
Example
To understand the data a bit better, we make an example. Imagine there are three pages (a, b, c) on the site and two checks are done on a day. The first check has a page speed of 2 seconds for a, 4 for b and 6 c. The second check has 2 seconds for a, 1 for b and 3 for c.
The math would then be 4 + 2 + 6 + 2 + 1 + 3 = 18 seconds. The average page speed would be 18 / 6 = 3 seconds.
Metric
As metric we use the "Largest Contentful Paint" metric from the Google Web Vitals report of the respective check for each page.