Once you're set up, you'll land on a clean, intuitive dashboard featuring a real-time line chart that visualizes your performed checks at a glance. Below it, you'll find a list of all your added sites, making it easy to monitor and manage everything from one central place.
Statistic
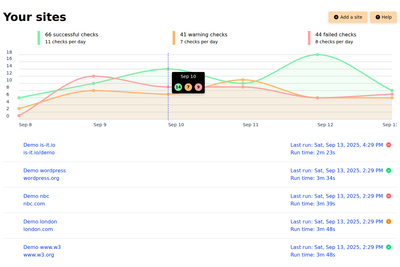
The line chart provides a detailed overview of your website’s health by displaying successful, warning, and failed checks, each represented by its own distinct line for easy comparison. The chart updates in real time, allowing you to quickly identify trends and spot issues as they arise. Accompanying the chart, the legend gives you both the total number of checks in each category and a daily breakdown, helping you track performance over time with clarity and precision.
List sites
The list of sites lists your sites and their current status with information about the last check. Clicking on a site, navigates you to the details page where the site pages are displayed and all the checks are listed.